< Top 350 World University List can be found at the bottom of this page >
The top five universities in the ranking were: University of Oxford, Stanford University, Massachusetts Institute of Technology, Harvard University and University of Cambridge.
There was some rearrangement among the top tier of universities compared to the 2023 ranking. U of T swapped spots with University of California, Los Angeles, which took 18th place, followed by National University of Singapore and Cornell University.
There has been a noticeable decline in the fortunes of US and UK universities this year, as well as a further slide for European universities. An analysis of six years of data by THE shows that the average rank of US universities has declined from 296 in the 2019 rankings to 348 in the latest edition; the UK’s average rank has also sank but to a lesser extent, from 451 to 477.
~ Our “Elite Program” can help students enter these world-famous schools – please contact our center today (free enquiry: Tel 2391-9713, WhatsApp 5531-1001). ~
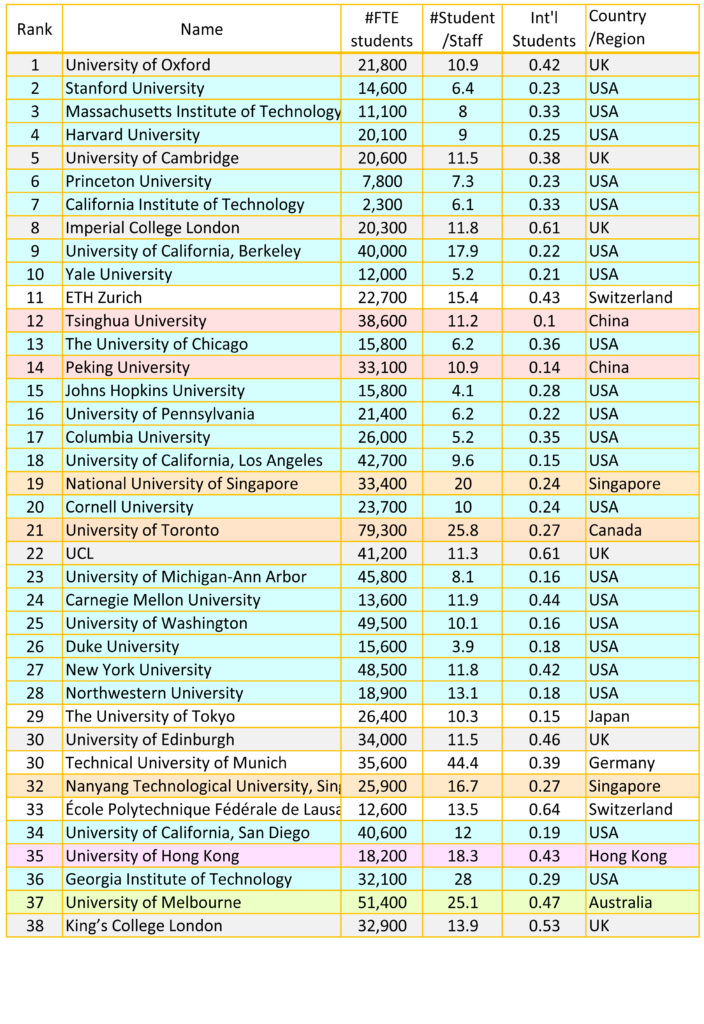
Overall, U of T continues to be one of the world’s top-ranked public universities in the five most closely watched international rankings. Other Canadian schools in the top 200 included: University of British Columbia (41st), McGill University (49th), McMaster University (103rd), University of Alberta (109th), Université de Montréal (111th) University of Waterloo (158th) and University of Ottawa (177th).
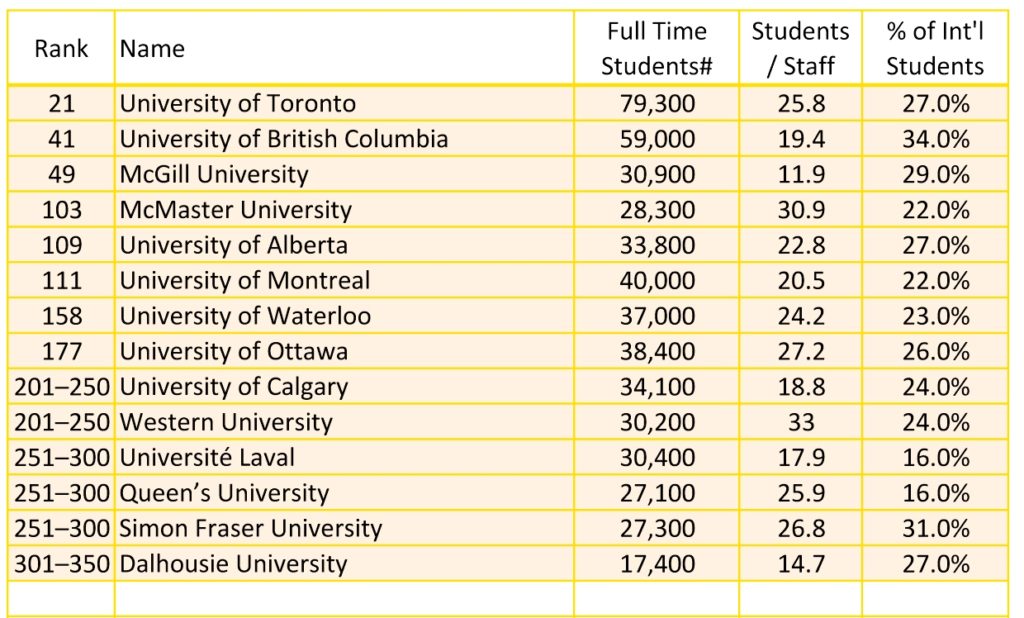
Weaker research quality and reputation ratings, higher student-staff ratios and lower international student and co-authorship scores were the main factors in Australia’s decline this year.
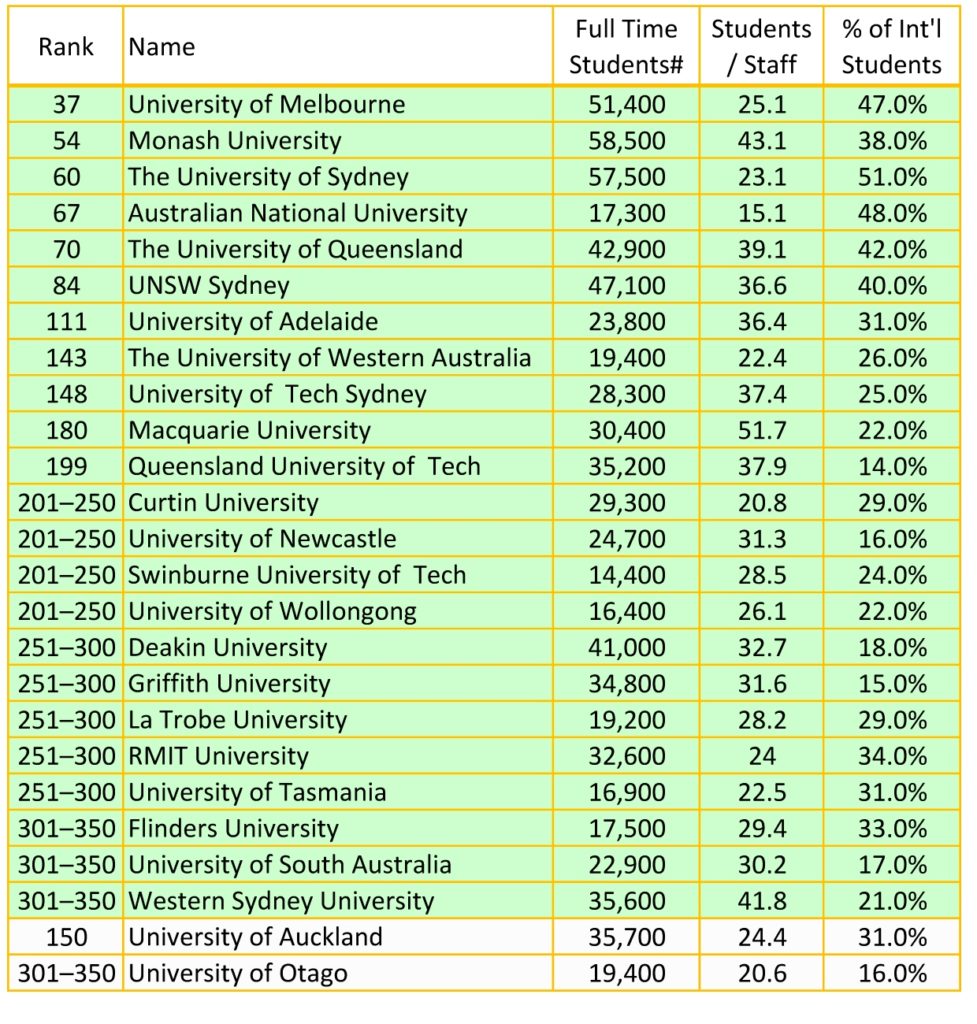
Asia saw the largest rise of all continents in research quality, teaching score, and overall performance in the latest World University Rankings.
It’s China making the biggest impression rather than the West.
China is edging closer to the top 10 and now has two institutions in the top 15 for the first time. Tsinghua and Peking universities both overtake the University of Pennsylvania, Johns Hopkins University and Columbia University to rank 12th and 14th respectively in this year’s 20th edition of the ranking.
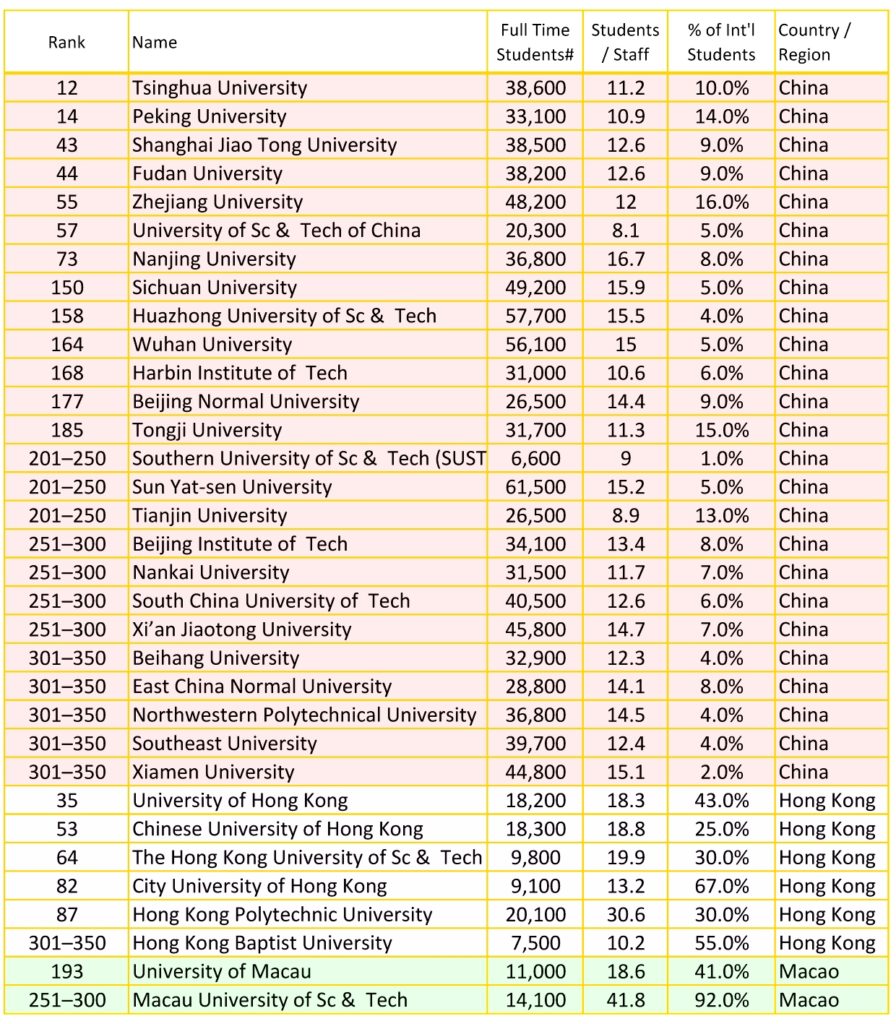
Meanwhile, Japan’s University of Tokyo now outperforms the University of Edinburgh, King’s College London and the London School of Economics and Political Science, after rising 10 places to 29th.
The United Arab Emirates-based University of Sharjah leads the international outlook pillar with a top score of 98.8, while City University of Hong Kong follows closely with 98.7.
India Rises in Global Representation
India’s ascent in the 2024 rankings extends beyond the number of universities featured. India has now risen to become the fourth most well-represented nation, advancing from sixth place in the previous year’s rankings. This upward trajectory reflects the increasing recognition of Indian universities on the global stage.
Top USA
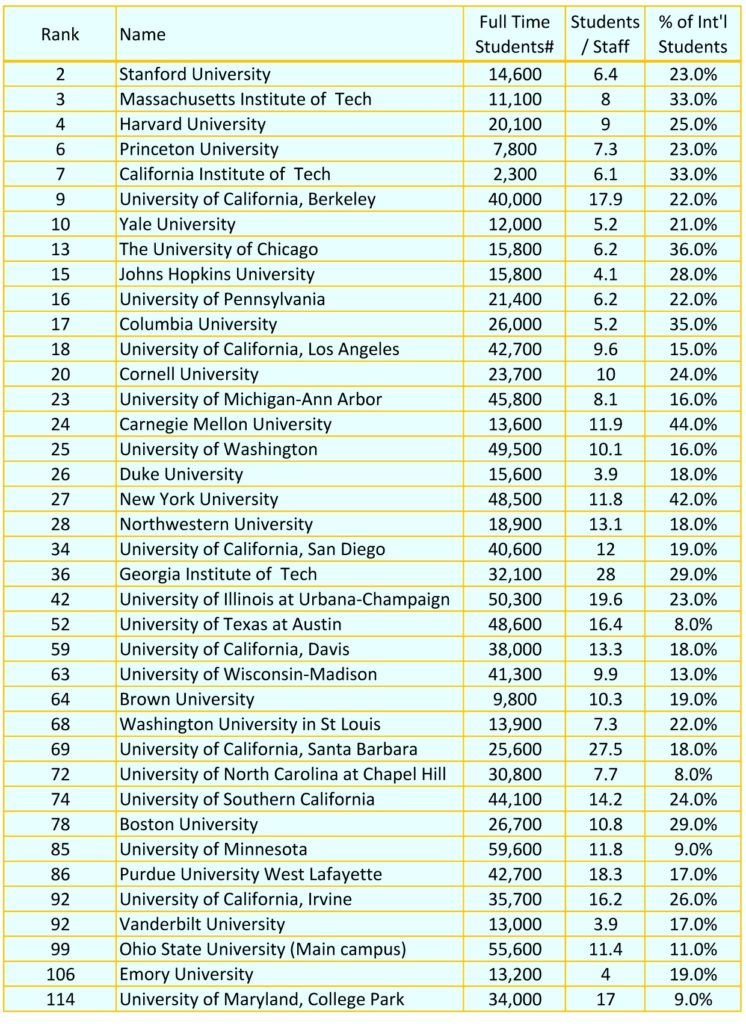
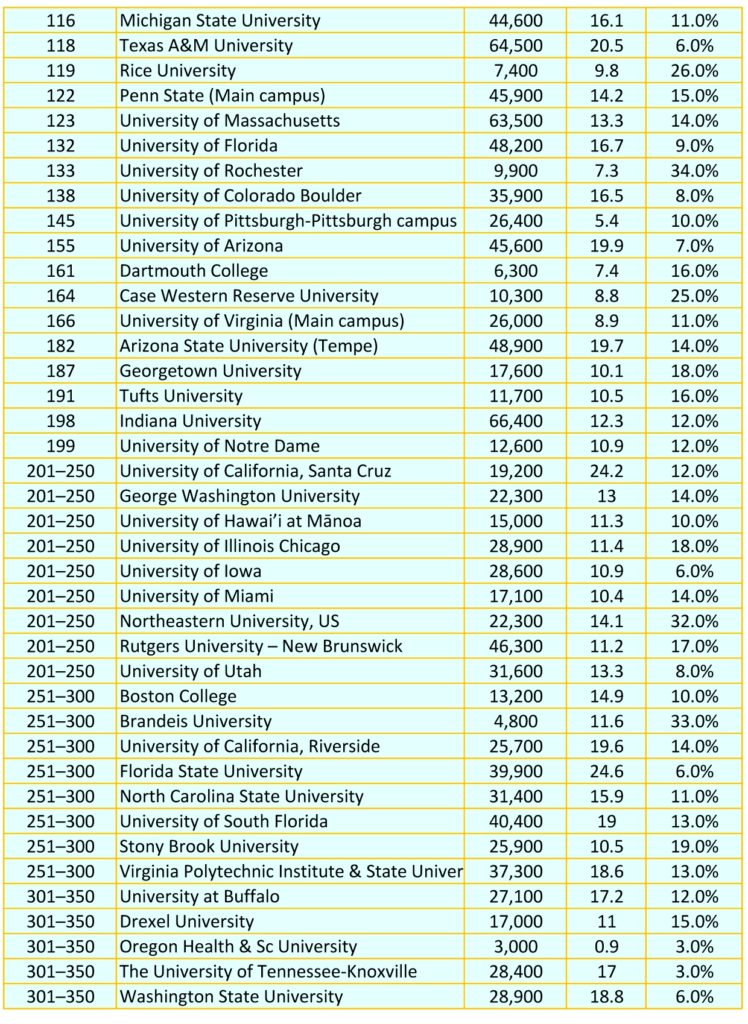
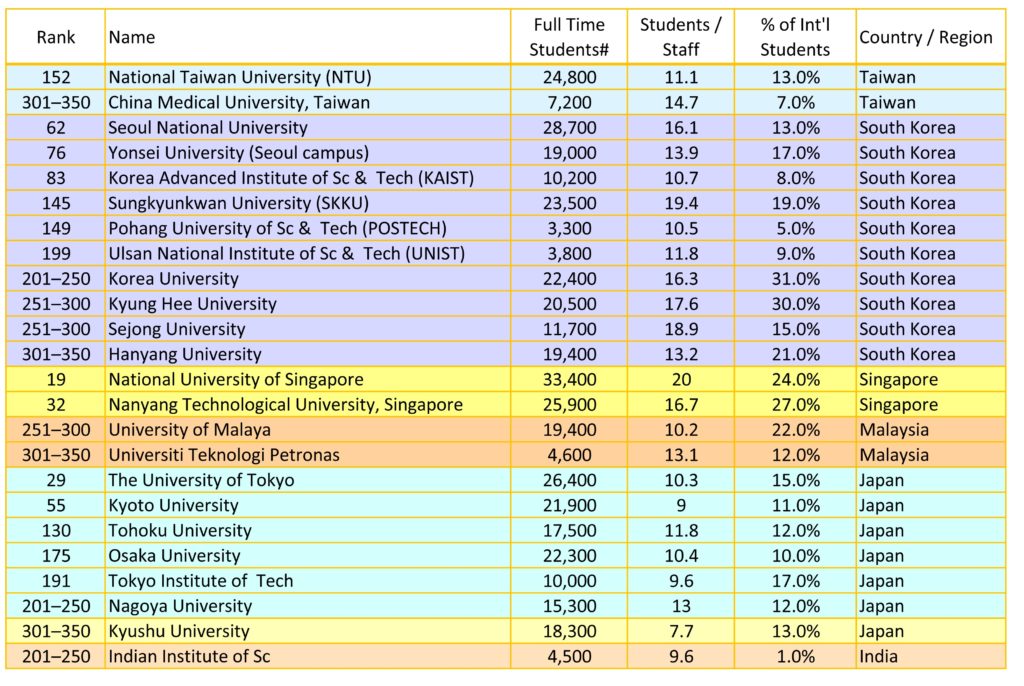
| Rank | Name | Full Time Students# | Students / Staff | % of Int’l Students | Country / Region |
| 1 | University of Oxford | 21,800 | 10.9 | 42.0% | UK |
| 2 | Stanford University | 14,600 | 6.4 | 23.0% | USA |
| 3 | Massachusetts Institute of Tech | 11,100 | 8 | 33.0% | USA |
| 4 | Harvard University | 20,100 | 9 | 25.0% | USA |
| 5 | University of Cambridge | 20,600 | 11.5 | 38.0% | UK |
| 6 | Princeton University | 7,800 | 7.3 | 23.0% | USA |
| 7 | California Institute of Tech | 2,300 | 6.1 | 33.0% | USA |
| 8 | Imperial College London | 20,300 | 11.8 | 61.0% | UK |
| 9 | University of California, Berkeley | 40,000 | 17.9 | 22.0% | USA |
| 10 | Yale University | 12,000 | 5.2 | 21.0% | USA |
| 11 | ETH Zurich | 22,700 | 15.4 | 43.0% | Switzerland |
| 12 | Tsinghua University | 38,600 | 11.2 | 10.0% | China |
| 13 | The University of Chicago | 15,800 | 6.2 | 36.0% | USA |
| 14 | Peking University | 33,100 | 10.9 | 14.0% | China |
| 15 | Johns Hopkins University | 15,800 | 4.1 | 28.0% | USA |
| 16 | University of Pennsylvania | 21,400 | 6.2 | 22.0% | USA |
| 17 | Columbia University | 26,000 | 5.2 | 35.0% | USA |
| 18 | University of California, Los Angeles | 42,700 | 9.6 | 15.0% | USA |
| 19 | National University of Singapore | 33,400 | 20 | 24.0% | Singapore |
| 20 | Cornell University | 23,700 | 10 | 24.0% | USA |
| 21 | University of Toronto | 79,300 | 25.8 | 27.0% | Canada |
| 22 | UCL | 41,200 | 11.3 | 61.0% | UK |
| 23 | University of Michigan-Ann Arbor | 45,800 | 8.1 | 16.0% | USA |
| 24 | Carnegie Mellon University | 13,600 | 11.9 | 44.0% | USA |
| 25 | University of Washington | 49,500 | 10.1 | 16.0% | USA |
| 26 | Duke University | 15,600 | 3.9 | 18.0% | USA |
| 27 | New York University | 48,500 | 11.8 | 42.0% | USA |
| 28 | Northwestern University | 18,900 | 13.1 | 18.0% | USA |
| 29 | The University of Tokyo | 26,400 | 10.3 | 15.0% | Japan |
| 30 | University of Edinburgh | 34,000 | 11.5 | 46.0% | UK |
| 30 | Technical University of Munich | 35,600 | 44.4 | 39.0% | Germany |
| 32 | Nanyang Technological University, Singapore | 25,900 | 16.7 | 27.0% | Singapore |
| 33 | École Polytechnique Fédérale de Lausanne | 12,600 | 13.5 | 64.0% | Switzerland |
| 34 | University of California, San Diego | 40,600 | 12 | 19.0% | USA |
| 35 | University of Hong Kong | 18,200 | 18.3 | 43.0% | Hong Kong |
| 36 | Georgia Institute of Tech | 32,100 | 28 | 29.0% | USA |
| 37 | University of Melbourne | 51,400 | 25.1 | 47.0% | Australia |
| 38 | King’s College London | 32,900 | 13.9 | 53.0% | UK |
| 38 | LMU Munich | 34,700 | 33.5 | 18.0% | Germany |
| 40 | Paris Scs et Lettres – PSL Research University Paris | 16,200 | 15 | 22.0% | France |
| 41 | University of British Columbia | 59,000 | 19.4 | 34.0% | Canada |
| 42 | University of Illinois at Urbana-Champaign | 50,300 | 19.6 | 23.0% | USA |
| 43 | Shanghai Jiao Tong University | 38,500 | 12.6 | 9.0% | China |
| 44 | Fudan University | 38,200 | 12.6 | 9.0% | China |
| 45 | KU Leuven | 49,500 | 37.3 | 19.0% | Belgium |
| 46 | London School of Economics & Political Sc | 12,000 | 12.6 | 72.0% | UK |
| 47 | Universität Heidelberg | 19,400 | 13.3 | 20.0% | Germany |
| 48 | Delft University of Tech | 21,300 | 15.9 | 30.0% | Netherlands |
| 49 | McGill University | 30,900 | 11.9 | 29.0% | Canada |
| 50 | Karolinska Institute | 8,100 | 9.9 | 27.0% | Sweden |
| 51 | University of Manchester | 40,800 | 15.6 | 45.0% | UK |
| 52 | University of Texas at Austin | 48,600 | 16.4 | 8.0% | USA |
| 53 | Chinese University of Hong Kong | 18,300 | 18.8 | 25.0% | Hong Kong |
| 54 | Monash University | 58,500 | 43.1 | 38.0% | Australia |
| 55 | Kyoto University | 21,900 | 9 | 11.0% | Japan |
| 55 | Zhejiang University | 48,200 | 12 | 16.0% | China |
| 57 | University of Sc & Tech of China | 20,300 | 8.1 | 5.0% | China |
| 58 | Université Paris-Saclay | 31,700 | 13 | 24.0% | France |
| 59 | University of California, Davis | 38,000 | 13.3 | 18.0% | USA |
| 60 | The University of Sydney | 57,500 | 23.1 | 51.0% | Australia |
| 61 | University of Amsterdam | 28,700 | 13.2 | 36.0% | Netherlands |
| 62 | Seoul National University | 28,700 | 16.1 | 13.0% | South Korea |
| 63 | University of Wisconsin-Madison | 41,300 | 9.9 | 13.0% | USA |
| 64 | Brown University | 9,800 | 10.3 | 19.0% | USA |
| 64 | Wageningen University & Research | 15,900 | 18.1 | 28.0% | Netherlands |
| 64 | The Hong Kong University of Sc & Tech | 9,800 | 19.9 | 30.0% | Hong Kong |
| 67 | Australian National University | 17,300 | 15.1 | 48.0% | Australia |
| 68 | Washington University in St Louis | 13,900 | 7.3 | 22.0% | USA |
| 69 | University of California, Santa Barbara | 25,600 | 27.5 | 18.0% | USA |
| 70 | The University of Queensland | 42,900 | 39.1 | 42.0% | Australia |
| 71 | Institut Polytechnique de Paris | 6,100 | 6.8 | 42.0% | France |
| 72 | University of North Carolina at Chapel Hill | 30,800 | 7.7 | 8.0% | USA |
| 73 | Nanjing University | 36,800 | 16.7 | 8.0% | China |
| 74 | University of Southern California | 44,100 | 14.2 | 24.0% | USA |
| 75 | Sorbonne University | 41,600 | 14.5 | 22.0% | France |
| 76 | Yonsei University (Seoul campus) | 19,000 | 13.9 | 17.0% | South Korea |
| 77 | Leiden University | 35,100 | 19.3 | 21.0% | Netherlands |
| 78 | Boston University | 26,700 | 10.8 | 29.0% | USA |
| 79 | University of Groningen | 32,000 | 28.8 | 29.0% | Netherlands |
| 80 | University of Zurich | 25,700 | 14.7 | 24.0% | Switzerland |
| 81 | University of Bristol | 27,400 | 14.8 | 31.0% | UK |
| 82 | City University of Hong Kong | 9,100 | 13.2 | 67.0% | Hong Kong |
| 83 | Korea Advanced Institute of Sc & Tech (KAIST) | 10,200 | 10.7 | 8.0% | South Korea |
| 84 | UNSW Sydney | 47,100 | 36.6 | 40.0% | Australia |
| 85 | University of Minnesota | 59,600 | 11.8 | 9.0% | USA |
| 86 | Purdue University West Lafayette | 42,700 | 18.3 | 17.0% | USA |
| 87 | University of Glasgow | 32,300 | 14.4 | 43.0% | UK |
| 87 | Hong Kong Polytechnic University | 20,100 | 30.6 | 30.0% | Hong Kong |
| 87 | Humboldt University of Berlin | 34,800 | 54.5 | 18.0% | Germany |
| 90 | RWTH Aachen University | 35,000 | 43.3 | 29.0% | Germany |
| 91 | University of Bonn | 26,300 | 44.5 | 17.0% | Germany |
| 92 | University of California, Irvine | 35,700 | 16.2 | 26.0% | USA |
| 92 | Vanderbilt University | 13,000 | 3.9 | 17.0% | USA |
| 94 | Charité – Universitätsmedizin Berlin | 8,900 | 17.5 | 21.0% | Germany |
| 95 | Lomonosov Moscow State University | 32,700 | 9.6 | 37.0% | Russian Federation |
| 95 | University of Tübingen | 21,700 | 27.1 | 14.0% | Germany |
| 97 | University of Southampton | 20,000 | 13 | 35.0% | UK |
| 97 | KTH Royal Institute of Tech | 13,300 | 15.9 | 26.0% | Sweden |
| 99 | Ohio State University (Main campus) | 55,600 | 11.4 | 11.0% | USA |
| 99 | Erasmus University Rotterdam | 33,900 | 36 | 25.0% | Netherlands |
| 101 | University of Birmingham | 32,700 | 15.2 | 32.0% | UK |
| 102 | Free University of Berlin | 25,500 | 41.5 | 20.0% | Germany |
| 103 | University of Copenhagen | 31,800 | 4.3 | 14.0% | Denmark |
| 103 | McMaster University | 28,300 | 30.9 | 22.0% | Canada |
| 105 | University of Sheffield | 27,900 | 15.4 | 40.0% | UK |
| 106 | Emory University | 13,200 | 4 | 19.0% | USA |
| 106 | University of Warwick | 25,000 | 14.4 | 44.0% | UK |
| 106 | Lund University | 30,400 | 12 | 18.0% | Sweden |
| 109 | Aarhus University | 27,000 | 13.5 | 9.0% | Denmark |
| 109 | University of Alberta | 33,800 | 22.8 | 27.0% | Canada |
| 111 | University of Göttingen | 23,400 | 27.4 | 14.0% | Germany |
| 111 | University of Montreal | 40,000 | 20.5 | 22.0% | Canada |
| 111 | University of Adelaide | 23,800 | 36.4 | 31.0% | Australia |
| 114 | University of Maryland, College Park | 34,000 | 17 | 9.0% | USA |
| 115 | Ghent University | 41,500 | 37.6 | 12.0% | Belgium |
| 116 | Michigan State University | 44,600 | 16.1 | 11.0% | USA |
| 116 | University of Bern | 12,400 | 18.2 | 16.0% | Switzerland |
| 118 | Texas A&M University | 64,500 | 20.5 | 6.0% | USA |
| 119 | Rice University | 7,400 | 9.8 | 26.0% | USA |
| 119 | University of Vienna | 31,400 | 37.4 | 31.0% | Austria |
| 121 | University of Helsinki | 22,900 | 15.9 | 5.0% | Finland |
| 122 | Penn State (Main campus) | 45,900 | 14.2 | 15.0% | USA |
| 123 | University of Massachusetts | 63,500 | 13.3 | 14.0% | USA |
| 123 | University of Basel | 8,600 | 10.4 | 31.0% | Switzerland |
| 125 | Vrije Universiteit Amsterdam | 31,800 | 19.2 | 18.0% | Netherlands |
| 126 | Technical University of Denmark | 10,500 | 7.7 | 28.0% | Denmark |
| 127 | University of Oslo | 21,000 | 12.5 | 15.0% | Norway |
| 128 | University of Freiburg | 19,500 | 34.4 | 17.0% | Germany |
| 129 | University of Leeds | 33,500 | 14.4 | 32.0% | UK |
| 130 | University of Nottingham | 33,600 | 16 | 27.0% | UK |
| 130 | Tohoku University | 17,500 | 11.8 | 12.0% | Japan |
| 132 | University of Florida | 48,200 | 16.7 | 9.0% | USA |
| 133 | University of Rochester | 9,900 | 7.3 | 34.0% | USA |
| 134 | Trinity College Dublin | 18,800 | 22.2 | 34.0% | Ireland |
| 135 | Queen Mary University of London | 22,300 | 14.6 | 45.0% | UK |
| 136 | University of Hamburg | 29,300 | 58.5 | 13.0% | Germany |
| 136 | Technical University of Berlin | 20,500 | 49.6 | 29.0% | Germany |
| 138 | University of Colorado Boulder | 35,900 | 16.5 | 8.0% | USA |
| 138 | Maastricht University | 21,400 | 19.6 | 57.0% | Netherlands |
| 140 | Uppsala University | 24,800 | 13.3 | 17.0% | Sweden |
| 140 | Radboud University Nijmegen | 23,100 | 18.2 | 12.0% | Netherlands |
| 140 | Karlsruhe Institute of Tech | 21,500 | 20.5 | 25.0% | Germany |
| 143 | University of Lausanne | 14,500 | 10.5 | 23.0% | Switzerland |
| 143 | The University of Western Australia | 19,400 | 22.4 | 26.0% | Australia |
| 145 | University of Pittsburgh-Pittsburgh campus | 26,400 | 5.4 | 10.0% | USA |
| 145 | Sungkyunkwan University (SKKU) | 23,500 | 19.4 | 19.0% | South Korea |
| 147 | University of York | 19,600 | 16.1 | 31.0% | UK |
| 148 | University of Tech Sydney | 28,300 | 37.4 | 25.0% | Australia |
| 149 | Pohang University of Sc & Tech (POSTECH) | 3,300 | 10.5 | 5.0% | South Korea |
| 150 | University of Auckland | 35,700 | 24.4 | 31.0% | New Zealand |
| 150 | Sichuan University | 49,200 | 15.9 | 5.0% | China |
| 152 | National Taiwan University (NTU) | 24,800 | 11.1 | 13.0% | Taiwan |
| 152 | University of Barcelona | 44,400 | 15.3 | 11.0% | Spain |
| 152 | Université Paris Cité | 61,700 | 16.9 | 18.0% | France |
| 155 | University of Arizona | 45,600 | 19.9 | 7.0% | USA |
| 155 | Lancaster University | 15,400 | 13.9 | 38.0% | UK |
| 155 | University of Bologna | 74,200 | 24.7 | 11.0% | Italy |
| 158 | Huazhong University of Sc & Tech | 57,700 | 15.5 | 4.0% | China |
| 158 | University of Waterloo | 37,000 | 24.2 | 23.0% | Canada |
| 160 | University of Cologne | 31,300 | 28.7 | 17.0% | Germany |
| 161 | Dartmouth College | 6,300 | 7.4 | 16.0% | USA |
| 161 | TU Dresden | 29,800 | 29.4 | 17.0% | Germany |
| 161 | University of Antwerp | 16,200 | 31.8 | 17.0% | Belgium |
| 164 | Case Western Reserve University | 10,300 | 8.8 | 25.0% | USA |
| 164 | Wuhan University | 56,100 | 15 | 5.0% | China |
| 166 | University of Virginia (Main campus) | 26,000 | 8.9 | 11.0% | USA |
| 167 | University of Cape Town | 22,000 | 13.6 | 13.0% | South Africa |
| 168 | University of Liverpool | 26,000 | 14.2 | 32.0% | UK |
| 168 | Newcastle University | 25,700 | 14.8 | 26.0% | UK |
| 168 | Eindhoven University of Tech | 10,700 | 21.4 | 27.0% | Netherlands |
| 168 | Scuola Normale Superiore di Pisa | 700 | 7.4 | 11.0% | Italy |
| 168 | Harbin Institute of Tech | 31,000 | 10.6 | 6.0% | China |
| 168 | Université Catholique de Louvain | 25,500 | 37.3 | 20.0% | Belgium |
| 174 | Durham University | 19,600 | 14 | 32.0% | UK |
| 175 | Osaka University | 22,300 | 10.4 | 10.0% | Japan |
| 175 | University of Würzburg | 23,700 | 38.3 | 12.0% | Germany |
| 177 | University of Exeter | 27,200 | 16.6 | 28.0% | UK |
| 177 | Beijing Normal University | 26,500 | 14.4 | 9.0% | China |
| 177 | University of Ottawa | 38,400 | 27.2 | 26.0% | Canada |
| 180 | Macquarie University | 30,400 | 51.7 | 22.0% | Australia |
| 181 | Sapienza University of Rome | 60,600 | 22.2 | 9.0% | Italy |
| 182 | Arizona State University (Tempe) | 48,900 | 19.7 | 14.0% | USA |
| 183 | University of Geneva | 18,900 | 8.4 | 40.0% | Switzerland |
| 184 | University of Twente | 10,000 | 13.9 | 38.0% | Netherlands |
| 185 | Stockholm University | 29,800 | 20.3 | 13.0% | Sweden |
| 185 | Tongji University | 31,700 | 11.3 | 15.0% | China |
| 187 | Georgetown University | 17,600 | 10.1 | 18.0% | USA |
| 187 | University of Mannheim | 7,500 | 57.1 | 14.0% | Germany |
| 189 | Chalmers University of Tech | 10,200 | 15.4 | 17.0% | Sweden |
| 190 | Cardiff University | 28,900 | 15 | 27.0% | UK |
| 191 | Tufts University | 11,700 | 10.5 | 16.0% | USA |
| 191 | Tokyo Institute of Tech | 10,000 | 9.6 | 17.0% | Japan |
| 193 | University of St Andrews | 10,400 | 12.4 | 46.0% | UK |
| 193 | University of Macau | 11,000 | 18.6 | 41.0% | Macao |
| 193 | University of Erlangen-Nuremberg | 29,500 | 41.9 | 13.0% | Germany |
| 193 | University of Münster | 27,600 | 25.1 | 5.0% | Germany |
| 193 | Ulm University | 10,400 | 26.4 | 13.0% | Germany |
| 198 | Indiana University | 66,400 | 12.3 | 12.0% | USA |
| 199 | University of Notre Dame | 12,600 | 10.9 | 12.0% | USA |
| 199 | Ulsan National Institute of Sc & Tech (UNIST) | 3,800 | 11.8 | 9.0% | South Korea |
| 199 | Queensland University of Tech | 35,200 | 37.9 | 14.0% | Australia |
| 201–250 | University of California, Santa Cruz | 19,200 | 24.2 | 12.0% | USA |
| 201–250 | George Washington University | 22,300 | 13 | 14.0% | USA |
| 201–250 | University of Hawai’i at Mānoa | 15,000 | 11.3 | 10.0% | USA |
| 201–250 | University of Illinois Chicago | 28,900 | 11.4 | 18.0% | USA |
| 201–250 | University of Iowa | 28,600 | 10.9 | 6.0% | USA |
| 201–250 | University of Miami | 17,100 | 10.4 | 14.0% | USA |
| 201–250 | Northeastern University, US | 22,300 | 14.1 | 32.0% | USA |
| 201–250 | Rutgers University – New Brunswick | 46,300 | 11.2 | 17.0% | USA |
| 201–250 | University of Utah | 31,600 | 13.3 | 8.0% | USA |
| 201–250 | Abu Dhabi University | 2,600 | 10.9 | 60.0% | United Arab Emirates |
| 201–250 | University of Aberdeen | 12,800 | 15.3 | 40.0% | UK |
| 201–250 | University of Leicester | 14,000 | 13.9 | 31.0% | UK |
| 201–250 | Queen’s University Belfast | 20,900 | 17.2 | 41.0% | UK |
| 201–250 | University of Reading | 16,000 | 16.6 | 31.0% | UK |
| 201–250 | University of Sussex | 17,700 | 17.3 | 34.0% | UK |
| 201–250 | University of Gothenburg | 21,700 | 11.9 | 13.0% | Sweden |
| 201–250 | Autonomous University of Barcelona | 33,000 | 13.2 | 13.0% | Spain |
| 201–250 | Pompeu Fabra University | 12,200 | 22.7 | 13.0% | Spain |
| 201–250 | Korea University | 22,400 | 16.3 | 31.0% | South Korea |
| 201–250 | King Fahd University of Petroleum & Minerals | 6,900 | 8.5 | 15.0% | Saudi Arabia |
| 201–250 | Moscow Institute of Physics & Tech (MIPT) | 6,200 | 11.6 | 21.0% | Russian Federation |
| 201–250 | Tilburg University | 13,300 | 32.2 | 21.0% | Netherlands |
| 201–250 | University of Luxembourg | 5,600 | 21.3 | 49.0% | Luxembourg |
| 201–250 | Nagoya University | 15,300 | 13 | 12.0% | Japan |
| 201–250 | University of Padua | 44,500 | 26.5 | 7.0% | Italy |
| 201–250 | Politecnico di Milano | 39,000 | 25.7 | 19.0% | Italy |
| 201–250 | Sant’Anna School of Advanced Studies – Pisa | 800 | 7.4 | 20.0% | Italy |
| 201–250 | Tel Aviv University | 25,000 | 24.2 | 5.0% | Israel |
| 201–250 | University College Dublin | 23,500 | 20.7 | 25.0% | Ireland |
| 201–250 | Indian Institute of Sc | 4,500 | 9.6 | 1.0% | India |
| 201–250 | Friedrich Schiller University Jena | 16,100 | 18.9 | 14.0% | Germany |
| 201–250 | Goethe University Frankfurt | 28,600 | 14.5 | 14.0% | Germany |
| 201–250 | University of Potsdam | 14,400 | 38.1 | 16.0% | Germany |
| 201–250 | Aalto University | 14,500 | 20.4 | 23.0% | Finland |
| 201–250 | Aalborg University | 17,300 | 14.9 | 12.0% | Denmark |
| 201–250 | Southern University of Sc & Tech (SUSTech) | 6,600 | 9 | 1.0% | China |
| 201–250 | Sun Yat-sen University | 61,500 | 15.2 | 5.0% | China |
| 201–250 | Tianjin University | 26,500 | 8.9 | 13.0% | China |
| 201–250 | University of Calgary | 34,100 | 18.8 | 24.0% | Canada |
| 201–250 | Western University | 30,200 | 33 | 24.0% | Canada |
| 201–250 | University of São Paulo | 83,200 | 13.9 | 2.0% | Brazil |
| 201–250 | Université Libre de Bruxelles | 30,300 | 51.7 | 30.0% | Belgium |
| 201–250 | Vrije Universiteit Brussel | 15,000 | 35.1 | 23.0% | Belgium |
| 201–250 | Medical University of Graz | 4,100 | 15.5 | 29.0% | Austria |
| 201–250 | Medical University of Vienna | 7,300 | 8.4 | 30.0% | Austria |
| 201–250 | Curtin University | 29,300 | 20.8 | 29.0% | Australia |
| 201–250 | University of Newcastle | 24,700 | 31.3 | 16.0% | Australia |
| 201–250 | Swinburne University of Tech | 14,400 | 28.5 | 24.0% | Australia |
| 201–250 | University of Wollongong | 16,400 | 26.1 | 22.0% | Australia |
| 251–300 | Boston College | 13,200 | 14.9 | 10.0% | USA |
| 251–300 | Brandeis University | 4,800 | 11.6 | 33.0% | USA |
| 251–300 | University of California, Riverside | 25,700 | 19.6 | 14.0% | USA |
| 251–300 | Florida State University | 39,900 | 24.6 | 6.0% | USA |
| 251–300 | North Carolina State University | 31,400 | 15.9 | 11.0% | USA |
| 251–300 | University of South Florida | 40,400 | 19 | 13.0% | USA |
| 251–300 | Stony Brook University | 25,900 | 10.5 | 19.0% | USA |
| 251–300 | Virginia Polytechnic Institute & State University | 37,300 | 18.6 | 13.0% | USA |
| 251–300 | Khalifa University | 3,300 | 9.3 | 41.0% | United Arab Emirates |
| 251–300 | University of Bath | 15,300 | 15.8 | 31.0% | UK |
| 251–300 | University of East Anglia | 16,500 | 14.3 | 21.0% | UK |
| 251–300 | Loughborough University | 16,200 | 13.9 | 25.0% | UK |
| 251–300 | University of Surrey | 14,700 | 16.3 | 33.0% | UK |
| 251–300 | Swansea University | 18,600 | 16.8 | 21.0% | UK |
| 251–300 | Università della Svizzera italiana | 3,800 | 14 | 67.0% | Switzerland |
| 251–300 | Linköping University | 15,300 | 14.9 | 15.0% | Sweden |
| 251–300 | Kyung Hee University | 20,500 | 17.6 | 30.0% | South Korea |
| 251–300 | Sejong University | 11,700 | 18.9 | 15.0% | South Korea |
| 251–300 | King Abdulaziz University | 60,600 | 13.9 | 3.0% | Saudi Arabia |
| 251–300 | Qatar University | 10,100 | 8.4 | 36.0% | Qatar |
| 251–300 | University of Bergen | 15,800 | 13 | 11.0% | Norway |
| 251–300 | University of Malaya | 19,400 | 10.2 | 22.0% | Malaysia |
| 251–300 | Macau University of Sc & Tech | 14,100 | 41.8 | 92.0% | Macao |
| 251–300 | Humanitas University | 2,000 | 17.9 | 18.0% | Italy |
| 251–300 | Vita-Salute San Raffaele University | 4,100 | 13.9 | 5.0% | Italy |
| 251–300 | RCSI University of Medicine & Health Scs | 2,800 | 23.9 | 67.0% | Ireland |
| 251–300 | Semmelweis University | 10,000 | 12.8 | 37.0% | Hungary |
| 251–300 | Heinrich Heine University Düsseldorf | 28,200 | 30.1 | 13.0% | Germany |
| 251–300 | University of Hohenheim | 8,400 | 37.7 | 14.0% | Germany |
| 251–300 | Johannes Gutenberg University of Mainz | 30,800 | 24.1 | 11.0% | Germany |
| 251–300 | University of Konstanz | 7,600 | 34.5 | 11.0% | Germany |
| 251–300 | Ruhr University Bochum | 37,800 | 46.7 | 16.0% | Germany |
| 251–300 | University of Stuttgart | 15,200 | 25.3 | 20.0% | Germany |
| 251–300 | Technical University of Darmstadt | 15,900 | 37 | 19.0% | Germany |
| 251–300 | École Normale Supérieure de Lyon | 2,100 | 7.9 | 11.0% | France |
| 251–300 | Lappeenranta-Lahti University of Tech LUT | 5,100 | 31.6 | 14.0% | Finland |
| 251–300 | University of Oulu | 10,800 | 20.8 | 8.0% | Finland |
| 251–300 | University of Southern Denmark | 18,300 | 9.9 | 13.0% | Denmark |
| 251–300 | Beijing Institute of Tech | 34,100 | 13.4 | 8.0% | China |
| 251–300 | Nankai University | 31,500 | 11.7 | 7.0% | China |
| 251–300 | South China University of Tech | 40,500 | 12.6 | 6.0% | China |
| 251–300 | Xi’an Jiaotong University | 45,800 | 14.7 | 7.0% | China |
| 251–300 | Université Laval | 30,400 | 17.9 | 16.0% | Canada |
| 251–300 | Queen’s University | 27,100 | 25.9 | 16.0% | Canada |
| 251–300 | Simon Fraser University | 27,300 | 26.8 | 31.0% | Canada |
| 251–300 | Medical University of Innsbruck | 3,400 | 12.9 | 44.0% | Austria |
| 251–300 | TU Wien | 11,400 | 19 | 31.0% | Austria |
| 251–300 | Deakin University | 41,000 | 32.7 | 18.0% | Australia |
| 251–300 | Griffith University | 34,800 | 31.6 | 15.0% | Australia |
| 251–300 | La Trobe University | 19,200 | 28.2 | 29.0% | Australia |
| 251–300 | RMIT University | 32,600 | 24 | 34.0% | Australia |
| 251–300 | University of Tasmania | 16,900 | 22.5 | 31.0% | Australia |
| 301–350 | University at Buffalo | 27,100 | 17.2 | 12.0% | USA |
| 301–350 | Drexel University | 17,000 | 11 | 15.0% | USA |
| 301–350 | Oregon Health & Sc University | 3,000 | 0.9 | 3.0% | USA |
| 301–350 | The University of Tennessee-Knoxville | 28,400 | 17 | 3.0% | USA |
| 301–350 | Washington State University | 28,900 | 18.8 | 6.0% | USA |
| 301–350 | United Arab Emirates University | 8,200 | 12.6 | 18.0% | United Arab Emirates |
| 301–350 | University of Dundee | 14,200 | 18.1 | 25.0% | UK |
| 301–350 | University of Essex | 15,600 | 16 | 41.0% | UK |
| 301–350 | Royal Holloway, University of London | 11,300 | 16.1 | 31.0% | UK |
| 301–350 | St George’s, University of London | 3,800 | 13.1 | 18.0% | UK |
| 301–350 | University of Strathclyde | 20,400 | 16.3 | 25.0% | UK |
| 301–350 | China Medical University, Taiwan | 7,200 | 14.7 | 7.0% | Taiwan |
| 301–350 | Swedish University of Agricultural Scs | 4,500 | 4.7 | 8.0% | Sweden |
| 301–350 | University of Navarra | 12,000 | 14.3 | 26.0% | Spain |
| 301–350 | Hanyang University | 19,400 | 13.2 | 21.0% | South Korea |
| 301–350 | Stellenbosch University | 25,200 | 25.7 | 7.0% | South Africa |
| 301–350 | University of the Witwatersrand | 27,800 | 24.4 | 7.0% | South Africa |
| 301–350 | Norwegian University of Sc & Tech | 37,900 | 15 | 9.0% | Norway |
| 301–350 | University of Otago | 19,400 | 20.6 | 16.0% | New Zealand |
| 301–350 | Universiti Teknologi Petronas | 4,600 | 13.1 | 12.0% | Malaysia |
| 301–350 | Kyushu University | 18,300 | 7.7 | 13.0% | Japan |
| 301–350 | Catholic University of the Sacred Heart | 28,900 | 39.1 | 7.0% | Italy |
| 301–350 | University of Pavia | 17,800 | 31.5 | 9.0% | Italy |
| 301–350 | University of Rome II – Tor Vergata | 18,500 | 24 | 20.0% | Italy |
| 301–350 | Hebrew University of Jerusalem | 19,300 | 8.9 | 5.0% | Israel |
| 301–350 | University of Galway | 15,800 | 26.1 | 16.0% | Ireland |
| 301–350 | University College Cork | 18,600 | 21.1 | 16.0% | Ireland |
| 301–350 | Sharif University of Tech | 9,400 | 21.8 | 2.0% | Iran |
| 301–350 | Hong Kong Baptist University | 7,500 | 10.2 | 55.0% | Hong Kong |
| 301–350 | University of Bremen | 12,300 | 19.5 | 13.0% | Germany |
| 301–350 | University of Kiel | 29,500 | 23.9 | 8.0% | Germany |
| 301–350 | Université Grenoble Alpes | 51,300 | 18.4 | 17.0% | France |
| 301–350 | Montpellier University | 40,800 | 20.5 | 15.0% | France |
| 301–350 | Tampere University | 16,300 | 20.7 | 7.0% | Finland |
| 301–350 | University of Turku | 13,600 | 15.7 | 6.0% | Finland |
| 301–350 | University of Tartu | 9,700 | 9 | 12.0% | Estonia |
| 301–350 | Copenhagen Business School | 16,800 | 27.5 | 23.0% | Denmark |
| 301–350 | Beihang University | 32,900 | 12.3 | 4.0% | China |
| 301–350 | East China Normal University | 28,800 | 14.1 | 8.0% | China |
| 301–350 | Northwestern Polytechnical University | 36,800 | 14.5 | 4.0% | China |
| 301–350 | Southeast University | 39,700 | 12.4 | 4.0% | China |
| 301–350 | Xiamen University | 44,800 | 15.1 | 2.0% | China |
| 301–350 | Dalhousie University | 17,400 | 14.7 | 27.0% | Canada |
| 301–350 | University of Liège | 23,600 | 29.2 | 20.0% | Belgium |
| 301–350 | University of Innsbruck | 15,400 | 23.7 | 48.0% | Austria |
| 301–350 | Flinders University | 17,500 | 29.4 | 33.0% | Australia |
| 301–350 | University of South Australia | 22,900 | 30.2 | 17.0% | Australia |
| 301–350 | Western Sydney University | 35,600 | 41.8 | 21.0% | Australia |
| 351–400 | Aix-Marseille University | 73,000 | 17.3 | 14.0% | France |
Topics
Methodology – How World University Rankings are Made?
Times Higher Education has unveiled its World University Rankings for 2024, encompassing 1,900 universities from across 100 countries and regions. The table has been constructed based on the newly introduced WUR 3.0 methodology, which meticulously assesses an institution’s performance in five key areas: teaching, research environment, research quality, industry engagement, and international outlook.
Times Higher Education also measures the international outlook of universities, the number of students compared to the university staff, and how universities are perceived globally.
It also takes into account the reputation of research done by universities and how often papers produced by universities were quoted around the world.
This year’s rankings have been drawn from more than 134 million citations sourced from 16.5 million research publications. Additionally, the rankings incorporate valuable insights from 68,400 scholars worldwide. In total, a staggering 411,789 data points were collected from over 2,670 institutions that actively participated in the data submission process. )
Australia Rankings 2024
Results from the 2024 edition suggest that the pandemic damaged the business model that had buttressed Australia’s seemingly irrepressible buoyancy in the rankings. Border closures undermined universities’ ability to harvest overseas tuition fees to compensate for shortfalls in research funding, while diluting the international mix of staff and students.
Covid-induced redundancies also exerted upward pressure on student-staff ratios that were already high by global standards. Tweaks to the ranking methodology and updates to United Nations Educational, Scientific and Cultural Organisation data that inform the distribution and country weightings of the reputation survey that determines one-third of the ranking scores also denied Australian universities crucial points in the competition for the highest spots.
Australia’s top universities have slipped down the world’s most prestigious academic league table, with every institution in the top 200 recording a lower rank than 12 months ago.
The slide down the Times Higher Education rankings comes after an overhaul of the methodology used to score universities, but analysts say Australia’s poor performance is because of a research funding shortfall as well as student to staff ratios, which are among the worst in the world.
The University of Sydney dropped six places to rank 60th in the world; behind the University of Melbourne, which dropped three places to 37th on the list; and Monash University, which dropped 10 places to 54th.
Australian National University dropped five places to 67th spot; the University of NSW dropped 13 places to 84th; and the University of Technology, Sydney dropped 15 places to rank 148th.
Times Higher Education chief global affairs officer Phil Baty said Australian universities had been outpaced by research investment of other institutions while a drop-off in international students from 30 to 26 per cent meant revenue and consequentially research funding had taken a hit.
“We’ve seen the rise of mainland Chinese and east Asian universities … Australia does not have the same level of the same drive and level of commitment,” he said.
The University of Sydney is among the best 60 universities in the world – just –but it has slipped in the rankings.
“In addition, while the rankings show Australia has historically very high levels of research quality, current figures show a relative under-investment in research, which sends a clear red-light warning.”
The student-to-staff ratio in Australian universities is among the worst in the world, with the index finding they are in the bottom 15 per cent of the 1900 institutions assessed.
“Student ratios were already low, but it has become lower because of a spate of redundancies at universities over the past few years,” Baty said.
Many leading UK universities remain over-reliant on China, despite the risk to such ties from geopolitical tensions.
September 27, 2023. Patrick Jack
UK researchers rely on Chinese collaborators for nearly a quarter of all outputs in some key fields, Times Higher Education World University Rankings data shows.
Analysis of Elsevier bibliometrics shows that UK- and China-based academics co-authored 24,000 research papers in 2022, representing 10.9 per cent of the UK’s total publications. This was up from 7.1 per cent in 2018.
However, in certain key disciplines the reliance on China was much greater. In engineering, Chinese collaborations accounted for 23.5 per cent of all UK outputs in 2022, up from 16.5 per cent five years previously.
Across the physical sciences, such partnerships made up 17.6 per cent of UK output last year.
Citing Clarivate data, the King’s report identified a range of more narrow subject areas where Chinese collaboration is even more prominent: for example, 45.5 per cent of UK research papers on automation control systems published between 2017 and 2021 in 21,000 leading journals had a China-based co-author.
Telecommunications, electrical engineering, artificial intelligence and information systems all had Chinese collaboration rates of between 30 and 40 per cent.
UK research institutions would face significant damage if they disengaged from China, and that “no viable alternative partner exists to fill the gap”.
It said that ministers and intelligence agencies needed to produce “clearer guidance” for “universities to maintain scientific collaboration and intellectual exchange with China for as long as the geopolitical context permits and it remains in the national interest”.
As the world’s largest spender on research and development, China was a vital partner in scientific research.
With the US and China locked in an intensifying contest for technological leadership that is already drawing in the UK and many other countries, the chances that the global scientific endeavour will be disrupted by geopolitics have risen sharply over the last two years.
Assessing and mitigating the impact of such disruption is a critical responsibility of university leaders and policymakers as they contemplate a global knowledge economy that could begin to deglobalise at pace.
Nevertheless, the continued concentration of Chinese doctoral students in high-tariff institutions, as well as Chinese nationals working in research in these institutions with links to Chinese research institutions, suggests that high levels of UK-Chinese co-authorship are likely to continue.
This highlights the need for institutions to look at how to diversify their research partnerships in particular areas, and for sector-wide institutions to adopt a strategic and long-term approach, including undertaking further analysis of where de-risking is necessary and supporting actions that can be taken.
Sources:
https://www.timeshighereducation.com/news/world-university-rankings-2024-australian-elite-falters
https://www.smh.com.au/national/nsw/top-australian-universities-slide-down-world-rankings-20230926-p5e7po.html
